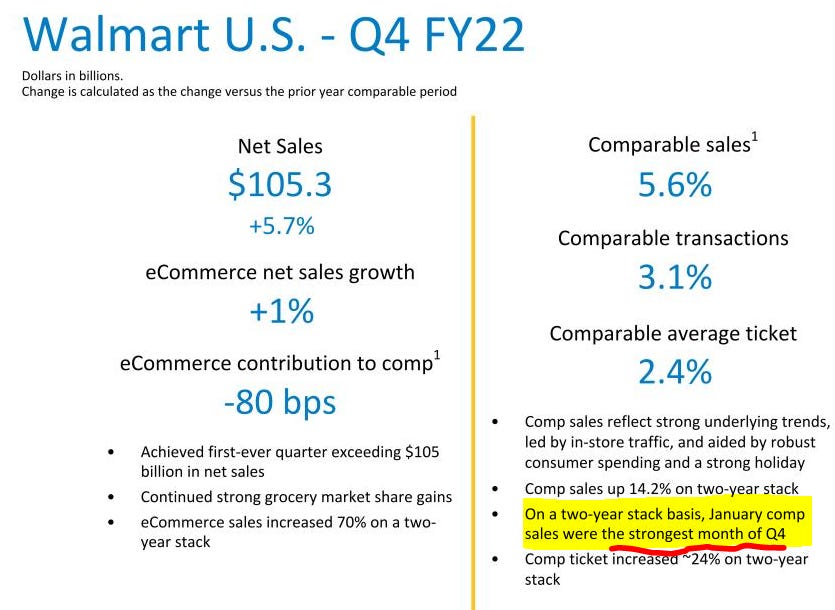
January appears to have been a strong month for consumer spending as noted by Walmart and US Census data, though Hibbett and others noted disappointing sales
Maersk noted they expect Ocean Freight to normalize in the 2nd half of 2022 while Walmart noted improvement in flow through at ports, though supply chain is still a headwind for most
Housing inventory continues to be very low with Redfin noting inventory down 12% year over year and noting strong demand saying “Of the listings that debuted in the middle of January, 58% went off the market in under 2 weeks, an all-time high. We thought the market was wild in mid-January last year when that number was 51%”
Travel demand is returning as noted by AirBNB, MGM, Kayak, and others
Consumer
Mastercard - $MA
The shift back to services: The pandemic arrested a decades-long trend of more spending on services vs goods. Since the middle of last year, this tide has begun to shift back to services – or experiences – as consumers resume in-person activities. According to Mastercard SpendingPulse, Restaurant sales grew 36.7% YOY and 16.6% compared to pre-pandemic levels.
Digital demand: E-commerce sales growth shows no signs of stopping, with double-digit increases in January even compared to the strong base in 2021. Compared to pre-pandemic levels, e-commerce sales were up 110.1%, underscoring the sustained and significant nature of the shift to digital.
New year, new looks: Apparel sales were up 37.6% in January YOY, the strongest growth rate for January in SpendingPulse history. The Apparel sector has experienced positive growth for 11 consecutive months as consumers refresh wardrobes and dress to impress for gatherings and events taking place in 2022. Department Stores have similarly gained from resurgent spending, with January sales up 10.5% YOY and 9.8% vs. pre-pandemic levels.
Luxe for loved ones: Luxury (+45.3% YOY) and Jewelry (+19.8% YOY) sales continued to outperform in January ahead of Valentine’s Day.
VISA - $V
The U.S. Spending Momentum Index (SMI) was 102.4 in January (seasonally adjusted), down from a revised 109.4 in December. The Visa SMI is an economic indicator of the health of consumer spending. When the Visa SMI rises above 100, the consumer spending momentum is strengthening and when it falls below 100, the spending momentum is weakening as fewer consumers are spending more relative to the previous year.
The SMI’s decline from December was due in large part to the rise in new COVID-19 cases with the spread of the Omicron variant. This current wave’s impact on spending was less than prior outbreaks, and for the most part has not derailed the recovery as more households continue to spend more than they did last year. Recent research from Visa Business and Economic Insights has further found that while consumer demand is less impacted by each successive wave, business disruptions have increased, contributing in part to rising inflation.
Walmart - $WMT
We expect total company sales to increase about 4% with Walmart U.S. comp sales slightly above 3% for the year. Given the timing of stimulus overlaps, we expect about a 1% to 2% comp sales increase from Walmart U.S. in the first quarter followed by somewhat higher comp sales growth throughout the remainder of the year.
US Retail Sales - US Census Bureau
First Cash - $FCFS
Additionally, there are potential impacts around the U.S. tax refund season due to expectations for delayed timing and size of the refunds (which may decline for many households due to advance funding of child tax credits in the second half of 2021) on consumer liquidity which could affect retail sales and customer payments in the first quarter of 2022. There is also the uncertainty around consumer behavior as government stimulus programs in place in the prior year have expired. As a result of these factors, the Company is not providing 2022 earnings guidance at this time.
Supply Chain
Maersk - $MAERSK
As highlighted earlier, this quarter, our Ocean business, again, was impacted by the continuation of the exceptional market conditions, which continue to put pressure on global supply chains. The congestion and network disruptions implied higher freight rates and an increase in costs, while volume and capacity utilization were restricted. Revenue in Ocean grew 77%, supported by an average freight rate increase of 83% and partially offset by a volume decrease, even though we saw stabilization in volumes sequentially.
So our guidance for the full-year 2022 is based on the assumption that we will have a strong first half, starting with the first quarter on par with the fourth quarter last year and that a normalization in Ocean will occur early in the second half of the year as labor returns to work, bottlenecks open up, capacity held up in port congestion is freed up, and new capacity delivered.
On the demand situation, in Ocean, we expect that we will grow in line with the global market demand of around somewhere between 2% and 4% in 2022.
Weber - $WEBR
For perspective, in Q1 2021, our global blended inbound cost of container was in the $3,500 to $4,500 range. Today, we are paying between $14,000 and $16,000 on average per container, a year-over-year cost escalation of 3x to 4x. In Q1, we shipped nearly 3,500 containers as we prepared for the coming grilling season. The negative impact to gross margin in the quarter was $31 million, an 11% impact on our gross margin rate or 52% of our year-over-year margin rate decline.
The current situation is driven by multiple factors, including congestion of outbound shipping capacity in China following the power restrictions imposed by the government during our first quarter, continued high demand for shipping due to the Christmas season and the shipping push leading up to the Lunar New Year. We are not expecting conditions to normalize during this fiscal year. And our projections currently have inbound freight representing 16% of our full year cost of goods sold, increasing more than 3x from 2 years ago on a percent of sales basis, from 3% to 10% of sales. This surge in freight creates a $150 million-plus headwind on the business that is difficult to overcome in the short term.
Walmart - $WMT
But what we're seeing right now is better flow through all across the supply chain. You heard the increase in inventory, a large reflection of what is inbound. So we see recovery have pretty quick. There are a couple of categories in the store that you'll see some out of stocks that are really national issues. And as far as the supply chain, we talked about it in Q3. There were some significant improvements in flow-through at ports, changing lead times, getting containers moved into the country and that's all helped. But just a reminder, about 2/3 of what we sell is manufactured or assembled here in the United States.
Shake Shack - $SHAK
But in January, a sharp increase of COVID cases limited our ability to staff and keep all of our restaurants fully open. Additionally, we saw many of the drivers of our business such as office returns, events, travel, tourism and the general gathering of people that contributes to Shake Shack's best results turn downward.
The combination of lower than average sales per hour, reduced operating hours and outright closures due to COVID resulted in materially lower sales versus our seasonal expectations. We expect these trends may continue to impact sales in our company-owned Shacks in our license business through the first quarter. However, we're happy to report a steady uptick in sales over the last few weeks, with fiscal February month-to-date Same-Shack sales of approximately 13% as of Tuesday of this week. With Omicron rates now plummeting, we'll point back to the fourth quarter as an indicator of the kind of momentum we know can occur as a more normalized consumer environment returns.
Hibbetts - $HIBB
Compared to the 13-week period ended January 30, 2021, comparable sales decreased 1.0% which is below our guidance of positive high single-digit comp sales. After a strong sales trend leading up to the Christmas holiday, traffic and transactions declined in the back half of the quarter. We believe disruption in the supply chain, most notably in the footwear category, coupled with consumer concern over inflation and an increase in COVID-19 cases driven by the Omicron variant were significant contributors to the sales shortfall.
Callaway - $ELY
As Chip mentioned, we believe there has been a structural shift in the market that will benefit each of our businesses including increased interest and participation in golf, momentum behind casual lifestyle apparel brands and an increased desire for leisure and entertainment, such as Topgolf, hiking and camping. As a result, we expect continued high demand and growth across each of our businesses into 2022 and beyond.
Labor
True Blue - $TBI
The demand for part-time and flexible hour employees across the U.S. is rising as companies look to fill gaps created by a worker shortage and the resulting difficulty in finding full-time employees. The number of job postings seeking part-time and flexible hour employees has jumped 13% in the last 30 days, with some jobs seeing an increase of as much as 3,000%, according to a new job posting analysis by staffing company PeopleReady.
DHI Group - $DHX
As a result, we finished the year strong with fourth quarter total revenue growth of 25% year-over-year and total bookings growth of 35% year-over-year as more employers use our subscription software tools. As demand for technologists continues to grow at a rapid pace and the unemployment rate for technologists remains at an all-time low, employers need sophisticated tools like ours to find, attract and engage with the right tech candidates.
Travel
MGM - $MGM
January, which typically relies more heavily on group business in Las Vegas, saw significant headwinds driven by groups mostly looking to postpone until later in the year. Cancellations, while elevated, were mostly concentrated in a very short term with limited impact beyond March. CES in January was the most visible event this year with attendance down approximately 70%.
And while we had occupancy drop last month, January was our highest booking month since March of 2021, and it was better than any single month in 2019. These are rooms that were booked in January for the future. Yes, we all feel pretty good about the outlook here in Las Vegas.
Disney - $DIS
Per capita spending at our domestic parks was up more than 40% versus fiscal first quarter 2019 driven by a more favorable guest and ticket mix, higher food, beverage and merchandise spending and contributions from Genie+ and Lightning Lane. Putting these factors together, our domestic parks and resorts delivered Q1 revenue and operating income exceeding pre-pandemic levels even as we continued managing attendance to responsibly address ongoing COVID considerations. Looking ahead to Q2, our demand pipeline for domestic guests at Walt Disney World and Disneyland remain strong, benefiting from our 50th anniversary celebration at Walt Disney World and new attractions and experiences at both parks.
AirBNB - $ABNB
And I think this is why bookings in January for this summer by nights booked are up 25% from this time in 2019. And other people are just going to take more extended weekends. The key point is that every length of stay on Airbnb is going up, whether it's 2 nights, 3 nights a week, a month or a season all length of stay up for single lines or open Airbnb. And we want to design for this new world by making it even easier for guests to live on Airbnb.
Kayak
Marriott - $MAR
I'll start with some thoughts on the first quarter of 2022. Omicron meaningfully impacted global group and business transient demand in January, historically the lowest occupancy month of the year. While we saw minimal disruption to leisure travel, global RevPAR for the month declined 31% compared to January of '19, primarily due to lower occupancy as rate was just 4% below 2019.
We expect to see the recovery pace pick up nicely in February and March given weekly bookings across customer segments have now returned to pre-Omicron levels. However, with some countries reinstituting strict travel restrictions earlier this year, we could see first quarter 2022 RevPAR compared to '19 levels take a step back from the 19% decline in the fourth quarter of '21 versus 2019. We then expect significant forward progression in the global recovery each quarter through the end of the year.
Housing
Redfin - $RDFN
New listings started to slow in January with the average number of new listings per day dropping 13%, mostly due to East Coast snow and ice. This was exactly when even more homebuyers were rushing into the market to beat rising mortgage rates. Of the listings that debuted in the middle of January, 58% went off the market in under 2 weeks, an all-time high. We thought the market was wild in mid-January last year when that number was 51%.
The problem is with individual homeowners, not builders. Despite builders’ supply chain problems, more than 1/3 of the single-family homes for sale in December were new, a record. The year prior, it was 25%, also a then-record. In the bubble years before the Great Financial Crisis, new construction never accounted for more than 20% of U.S. home sales.
And it’s not just the sellers who are increasingly institutions. It’s also the buyers. Investors accounted for 18% of fourth quarter U.S. home purchases, yet another record. Prior to the housing market’s decade-long bull run, investors rarely accounted for more than 10% of home purchases. With inventory scarce and sellers eager for the certainty of cash offers, retail homebuyers have been struggling to compete with investors.
But another group of homeowners who can afford to front the cash for their next home are increasingly deciding against ever selling the last one. One of the great unintended consequences of loaning money at rates fixed below 3% over 30 years is a landlord nation. Many of our home-buying customers are people who would once never have considered renting out their old place but now plan to hang onto that home and its mortgage for the rest of their lives.
For all these reasons, we believe that the inventory crunch will ease in the summer as rates rise but may not go away in 2022. We’re well aware of the economic pressures on homebuyers, but so many people are still so desperate to move that sales for now are still mostly constrained by inventory, not prices or even mortgage rates.
Legett and Platt - $LEG - 2022 guidance:
Sales are expected to be $5.3–$5.6 billion, +4% to +10% versus 2021
Volume expected to be flat to up mid-single digits
Raw material-related price increases expected to add sales growth
Based on this framework, EBIT margin should be 10.5% to 11.0% [vs 11.2% in 2021]
We expect continued strength in our Home Furniture business in 2022, as customer backlogs remained elevated. So far this year, the Chinese market has slowed as most manufacturers are taking early and longer Chinese New Year holidays to avoid anticipated COVID-related quarantines.
LaZ Boy - $LZB
Written same-store sales for the entire La-Z-Boy Furniture Galleries® network:
•Increased 3% for the fiscal 2022 third quarter compared with the fiscal 2021 third quarter
•Compared with the pre-pandemic fiscal 2020 third quarter, written same-store sales increased 9% for the fiscal 2022 third quarter, for a compound annual growth rate of approximately 4% over the two years
Odds and Ends
Sports Betting Legistlation - Kambi
In California, as many as four options could be on the ballot as part of a referendum on sports betting to occur later this year (8 November 2022). The only confirmed initiative currently on the ballot would allow retail-only sports wagering with Indian tribes or qualified sportsbook operators partnering with tribal casinos to offer online wagering in the state. The three other measures would allow for statewide mobile gaming and are either pending collection of voter signatures or being reviewed by the attorney general’s office.
Ohio has passed legislation to regulate mobile and retail sports betting, which is expected to go live in H2 2022 but no later than 1 January 2023. Ohio is the seventh most populous US state with a population of nearly 12 million people and is expected to be among the largest sports betting states at maturity.
In Georgia, major progress was made toward legalising mobile sports betting in 2021, with lawmakers reaching a consensus that sports wagering would require a constitutional referendum and passing a bill to permit at least a half-dozen online operators under the authority of the state lottery. Further discussions will be during the legislative session running ahead of a potential referendum on 8 November 2022.
Pershing Square - $PSH
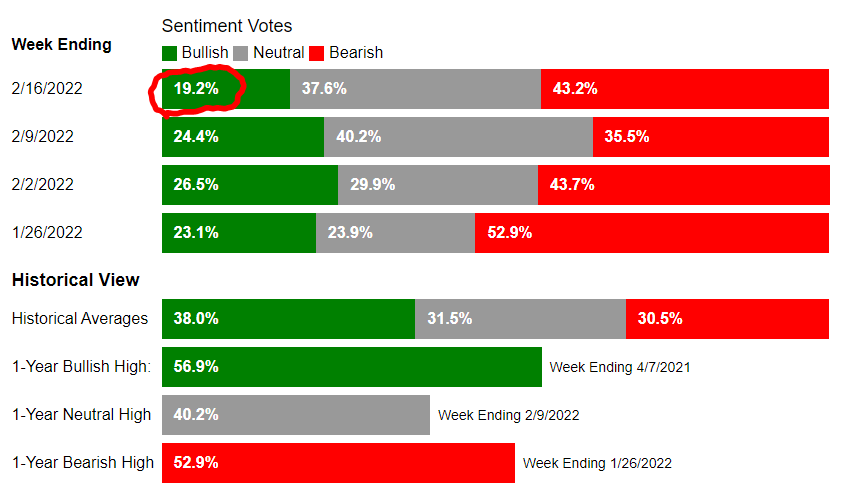
AAII Bulls Bears
CNN
[Source: JP Morgan] There hasn't been a 50 bps hike since 2000 and there hasn't been an intra-meeting hike since 1994. Such a move would be rare, yet not unprecedented. Here’s a brief history of when Fed officials have convened by conference call and delivered an inter-meeting shift to monetary policy:
o October 8, 2008 – 50 bps cut to 1.5% (Lehman)
o January 22, 2008 – 75 bps cut to 3.5% (signs of US recession)
o August 17, 2007 – 50 bps cut to 5.75% (subprime mortgage collapse)
o September 17, 2001 – 50 bps cut to 3% (9/11 aftermath)
o April 18, 2001 – 50 bps cut (slumping economy)
o January 3, 2001 – 50 bps cut to 6% (tech bubble burst)
o October 15, 1998 – 25 bps cut to 5% (LTCM)
o April 18, 1994 – 25 bps hike to 3.75% (Alan Greenspan being Alan Greenspan)