
Facts from the Week: June 26, 2022
Highlights from $MA $VAC $FDX $PROG $SWBI $LEN $LZB $KBH $GMS $RDFN $FMCC $DHX

Consumer
Mastercard - $MA
According to Mastercard SpendingPulse, total U.S. retail sales excluding automotive increased 10.5% year-over-year in May, and 21.4% compared to pre-pandemic May 2019. This is outpacing YOY monthly growth experienced thus far in 2022. In-store sales were a key driver, up 13.7% compared to pre-pandemic levels.
While inflation is impacting retail sectors and households in a myriad of ways, continued consumer demand contributed to double-digit growth across nearly all retail sectors in May. This is according to Mastercard SpendingPulse™, which measures in-store and online retail sales across all forms of payment, not adjusted for inflation. As we look ahead to the critical mid-July through Labor Day back-to-school period, U.S. retail sales are expected to grow 7.5% excluding automotive compared to 2021. Sales are anticipated to be up 18.3% compared to pre-pandemic 2019, with Department Stores expected to be a noteworthy winner as the sector continues its recent rebound.

Marriott Vacation Club - $VAC
"We continue to see very high owner occupancies at our resorts, enabling us to drive strong tour growth and contract sales during the second quarter of 2022. As a result of this, combined with the continued strength in our VPGs, we are increasing our full year contract sales guidance by $100 million for 2022," - CEO
The Company continues to expect Adjusted development profit margin to remain strong for the full year 2022. However, with owner occupancies exceeding expectations, the Company has allocated more rental inventory for owner usage to increase their vacation choices. Similarly, the Company continues to see higher owner usage at resorts affiliated with Interval International, which has impacted member deposits and exchanges. Given the increased owner usage, the updated guidance reflects the expected impact on rental and exchange revenue and profit this year. The Company expects owner usage to normalize in 2023.
Fedex - $FDX
Now let me take a moment to discuss 2023. We anticipate consumers will keep spending, and their spending will continue tilting towards services from goods. We expect more consumers to return to stores. With this backdrop, we do expect pressure on B2C volumes. Through May, industrial activity has been solid. But today's June flash of PMI was a sharp decline. Further, after a strong build late last year and early this year, inventory restocking is slowing. This will dampen Freight demand.
We continue to expect passenger airlines to fully recover to pre-COVID levels and that, that recovery will take some time. Belly capacity on passenger airlines is expected to remain constrained in fiscal year 2023, resulting in a pricing environment still favorable to FedEx if a little less than before.
PROG Holdings - $PROG
Since the Company issued its first quarter results on April 27, 2022, the macro environment has deteriorated further, resulting in increased delinquencies and higher write-offs within Progressive Leasing’s lease portfolio. Because the Company anticipates a challenging and volatile macro environment for the remainder of the year, it has further tightened its lease decisioning, which the Company expects will adversely impact GMV in the second quarter and full-year 2022. Progressive Leasing has made decisioning changes several times since the beginning of February, resulting in a reduction in approval rates of several hundred basis points.
“Rampant inflation is imposing significant pressure on our customers, who are feeling the pain of higher gas, food, and housing costs more significantly than those with higher incomes, as a larger portion of their paychecks are now being consumed by necessities. As a result, key national and regional point-of-sale partners are seeing a decrease in demand from our customer base,”-CEO
Smith & Wesson - $SWBI
While interest in the shooting sports remains healthy, and we are encouraged to hear from our channel partners that many first-time consumers are returning to purchase additional firearms, with the offsetting impact of record inflationary pressures on the pocket books of Main Street American households, we are anticipating that demand in the firearms market this year will look a lot like calendar 2019, which, as a reminder, would have encompassed the second half of our fiscal '19 and the first half of our fiscal '20.
Housing
Lennar - $LEN
While the market has cooled, it has clearly not stopped. Demand remains reasonably strong as buyers still have down payments and have attractive credit scores and can qualify. Household formation has continued to rise. And although we have adjusted some prices in many markets, those prices remain higher on a year-over-year basis. Buyers are seeking shelter from inflationary pressures as scarce rentals drive rents higher.
Supply remains limited across the country and the need for affordable workforce housing continues to be at crisis levels. Clearly, production must catch up to the growing household numbers as production of dwellings over the past decade has lagged prior decades by as many as 5 million homes. Nevertheless, the rapid increase in interest rates, together with price appreciation have created at least sticker shock and perhaps a more structural cooling of demand.
So far in June, new orders, traffic, sales incentives and cancellations have worsened in many of our markets due to a rapid spike in mortgage rates and headwinds from negative economic headlines. Many markets have also slowed as we've entered a seasonably slower part of the year.
LaZ Boy - $LZB
As far as the consumer, the entire industry over the last 3, 4 months is certainly seeing a slowdown in traffic. And I think there's a couple of things driving that. Overall, consumer sentiment, no doubt, is challenged. As we talked about and everything from inflation and we can certainly go into some more there.
The other piece that I think we don't know the relative impact of each of these is the return of seasonality. So for the last couple of years, we really haven't had kind of a big difference quarter-to-quarter in consumer sentiment. This is the first spring in several years that consumers were getting a regular spring and summer. People are traveling again, all. And so if you go back pre-pandemic, the spring and summer were always significantly slower than kind of the back half of our year. And so that return of seasonality is definitely driving some of it. And then we have to keep in mind that furniture pricing is still quite high, right, across the industry. We're 25% to 35% higher due to all of the input costs than we were pre-pandemic. And again, those are all across the industry.
KB Home - $KBH
With respect to the supply chain, we are seeing mixed dynamics with the availability of some materials such as paint, plumbing products, interior doors and door hardware improving sequentially. Other materials, such as engineered wood products, cabinets, insulation and concrete, continue to be difficult to obtain but have stabilized. And the third group of products, including heating and cooling materials and electrical equipment, appliances and windows remain challenged. As to trade labor, the impact from COVID-related shortages was less severe than it was in our first quarter. However, we continue to manage through trade labor shortages in our second quarter and remain watchful with any shifts in contractor labor availability.
We analyzed specifically in the quarter, just our May order activity because that was the most recent data after, frankly, all the interest rates had run up. And what we saw in consumer behavior was nothing really changed in the footage of the home that they were picking. And so far, nothing has really changed in the dollar spend at the studio. So it stayed very consistent. If you go back to the comments I made about our buyer profile that closed in the quarter at an average income of $125,000 in the credit metrics and the down payment, they actually could absorb more interest rate than we've seen so far and still buy the homes that they're choosing.
GMS Inc - $GMS
Net sales for the fourth quarter of fiscal 2022 of $1.29 billion increased 38.2% as compared with the prior year quarter, primarily due to inflationary pricing, healthy residential end market demand, strong performance from our complementary products and the acquisitions of Westside Building Material and AMES Taping Tools. Organic net sales increased 28.9%.
Based on the continued strength we expect in near-term residential demand, we currently expect to generate year-over-year organic sales growth in the low 20% range or approximately 30% total net sales growth, inclusive of our already completed acquisitions. And we expect first quarter gross margin to be generally consistent with that of the prior year, using the assumption that steel prices will pull back modestly while wallboard prices should increase sequentially, each in the low to mid-single digits.
We again expect product price inflation to exceed inflationary and accelerated activity driven increases in operating expenses. Therefore, we expect incremental EBITDA margins to moderate to roughly 12%.
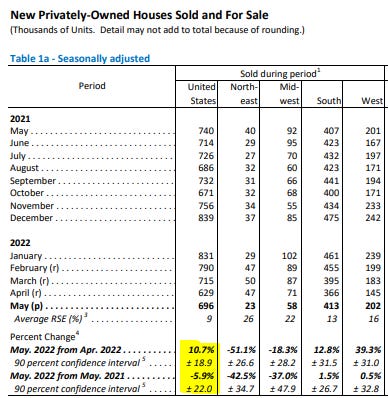
New Homes Sold in May - US Census
Redfin - $RDFN
The median home sale price was up 14% year over year to a record $399,998.
The median asking price of newly listed homes increased 16% year over year to $405,998.
The monthly mortgage payment on the median asking price home increased to $2,500 at the current 5.81% mortgage rate. This was up 48% from $1,693 a year earlier, when mortgage rates were 3.02%.
Pending home sales were down 10% year over year, the largest decline since May 2020.
New listings of homes for sale were down 2% from a year earlier.
Active listings (the number of homes listed for sale at any point during the period) fell 5% year over year—the smallest decline since December 2019.
48% of homes that went under contract had an accepted offer within the first two weeks on the market, down from 50% a year earlier.
For the week ending June 23, 30-year mortgage rates rose to 5.81%—the highest level since November 2008.
Fewer people searched for “homes for sale” on Google—searches during the week ending June 18 were down 14% from a year earlier.
The seasonally-adjusted Redfin Homebuyer Demand Index—a measure of requests for home tours and other home-buying services from Redfin agents—was down 16% year over year during the week ending June 19. This was the largest decline since April 2020.
Touring activity as of June 19 was 6% below the start of the year compared to a 24% increase at this time last year, according to home tour technology company ShowingTime.
Mortgage purchase applications were down 10% from a year earlier, while the seasonally-adjusted index was up 8% week over week during the week ending June 17.
Mortgage Rates - Freddie Mac - $FMCC

Labor
DHI Group - $DHX
We remain in one of the best markets for tech talent that we have ever seen. The growing demand for technologists at all levels has shown no signs of slowing and continues to be fueled by an evolution away from legacy systems, strengthening of cybersecurity infrastructure and other ongoing digital transformation initiatives — and these are happening across nearly every sector, as our new industry-specific Tech Job Reports show. It's been unfortunate that there have been layoffs and hiring freezes at some tech firms; however, we view these announcements as corrections specific to individual organizations and not indicative of the overall tech hiring market. - CEO
Overall, tech job postings are up 83% year to date and 42% from April to May 2022.
CompTIA
CompTIA’s analysis of today’s “#JobsReport” from the U.S. Bureau of Labor Statistics (BLS) shows that at the technology industry level companies added 22,800 net new workers in May. Through the first five months of 2022 employment has increased by 106,700 positions and is tracking 69% ahead of the same period versus 2021.
Employer hiring activity as measured by job postings for tech positions totaled 623,627 for the month and nearly 2.2 million year-to-date. This represents a 52% increase versus the same period of the previous year.